Conversational Co-Pilots for Observability

In the world of modern infrastructure and distributed systems, observability tools generate mountains of telemetry. But finding answers still requires manual queries, dashboard navigation, and deep platform knowledge.

This feature embeds an LLM-powered assistant directly into the observability platform, allowing SREs and developers to query telemetry data using natural language. Instead of writing complex queries or clicking through dashboards, a user can ask, “What caused the spike in error rate for Service X yesterday around 3 PM?” and the conversational co-pilot will return an analysis (e.g. “Service X saw a 5x increase in DB timeouts at 2:55 PM, likely due to deployment v1.2.3; dependent Service Y also had latency increases”). Under the hood, the co-pilot uses techniques like Retrieval-Augmented Generation (RAG), vector similarity search, and prompt engineering to fetch relevant data and generate useful answers.

Architectural Model

The co-pilot consists of several components working
together

Natural Language Interface

Typically a chat UI in the observability console where users pose questions or commands in plain English (or other languages). This interface sends the query to the back-end copilot service.

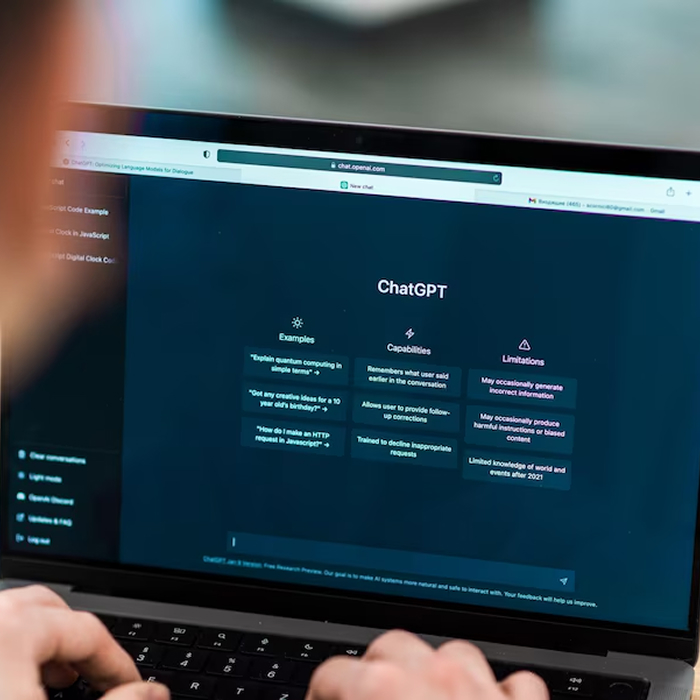
Think of it as ChatGPT for your observability stack, but purpose-built for infrastructure, applications, and ML pipelines.

What Can You Ask?

No more need to memorize PromQL, filter through dozens of dashboards, or correlate logs manually. With Perviewsis Co-Pilots, just ask:

Think of it as ChatGPT for your observability stack, but purpose-built for infrastructure, applications, and ML pipelines.
“Why did the payment API slow down yesterday?”
“Which services are failing health checks right now?”
“Show me latency trends for the last 24 hours by region.”
“What changed before the database errors began?”
“Did our model accuracy drop after the last deployment?”

The Co-Pilot will parse your intent, run the appropriate queries, analyze correlations, and return rich, human-readable responses with embedded charts, traces, and logs.

LLM Orchestration Service

This service manages the interaction with the Large Language Model. It takes the user’s question and formulates a strategy to answer it. Often, this involves breaking the problem into sub-tasks:

Identify Intent & Data Needs

The co-pilot interprets what the user is asking. Is it about logs, metrics, traces, or a combination? For example, “spike in error rate” implies we need metric data (error counts) and possibly related logs.

Retrieve Relevant Telemetry

Using RAG, the service can pull in the data required. If it’s a metrics question, it might translate the NL query into a time-series database query (e.g. a PromQL or SQL query). In fact, LLMs can translate natural language into structured queries almost instantly. For structured telemetry (like numeric metrics), the co-pilot might not need a vector search – it can directly generate the query based on the prompt (e.g., an LLM could produce something like “SELECT error_count FROM metrics WHERE service=’X’ and timestamp BETWEEN …” which the system then executes). For unstructured data (logs, traces, documentation), the co-pilot uses a vector index to find relevant pieces of text. It may have indexed log messages or runbook docs as embeddings so it can do semantic search. For instance, if the question is, “Has this error happened before?”, the co-pilot might semantic-search past incident reports or log clusters via a vector database to find similar incidents.

Inject Context & Prompt Engineering

The relevant retrieved data (e.g. a snippet of logs, a summary of yesterday’s metrics) is then fed into the LLM’s prompt. The system prompt might include instructions like: “You are an observability assistant. Given the following data and question, provide a concise explanation.” The retrieved telemetry is attached, and the user’s question is appended. This prompt engineering ensures the LLM has the necessary context and is guided to produce correct, factual
answers (reducing hallucinations).

LLM Response Generation

The Large Language Model (like GPT-4 or a fine-tuned variant) generates a response. This could be pure text or text with data visualizations. Advanced co-pilots might even produce graphs or dashboards on the fly. For example, if asked to “show the latency trend”, the co-pilot could return a small chart or link to a dashboard panel it created. Prompt engineering plays a role here – the LLM might be instructed to output answers in Markdown with code for charts if needed.

Follow-up and Interaction

The conversational nature means the user can ask follow-ups like “Is that higher than usual?” or “Which service is the likely culprit?”. The co-pilot keeps context of the conversation (possibly by maintaining the dialogue in the prompt or using conversation memory stored in a vector DB for the session). The retrieval step can use this context as well (e.g. knowing we are focusing on Service X and a certain time frame).

Integrated With the Full Observability Stack

Co-Pilots work across your telemetry layers:

Layer

  • Metrics
  • Logs
  • Traces
  • Events
  • Models

Co-Pilot Access

  • Prometheus, OpenTelemetry, Datadog
  • Fluentd, Elastic, Loki, Splunk
  • Jaeger, Zipkin, Honeycomb
  • Kubernetes, CI/CD, GitHub Actions, PagerDuty
  • MLflow, SageMaker, Vertex AI (for ML observability)

Co-Pilots connect to real-time and historical data across all these layers for complete situational awareness.

Benefits

Faster Root Cause Analysis:

Drastically reduce mean time to resolution (MTTR) by skipping manual dashboard hunting

Human-Friendly Access

Empower non-ops teams to get observability insights without deep technical knowledge

Actionable Workflows

Go from question to diagnosis to resolution in one interface

Improved Test Feedback

Co-Pilots can suggest or trigger tests based on telemetry insights

Built for Scale, Designed for People

Perviewsis Conversational Co-Pilots are enterprise-ready:

  • Role-based access and context-aware data filtering
  • Integration with Slack, Microsoft Teams, and web UI
  • Multi-language support and audit logs for enterprise compliance

Make Your Observability Stack Speak Your Language

In today’s complex, distributed environments, observability platforms generate millions of data points per second. But extracting value from that data is still a manual, time-consuming, and expert-driven process. You need to navigate dashboards, craft queries, interpret metrics, and correlate logs—often under pressure during incidents.

Perviewsis changes that paradigm with Conversational Co-Pilots

an AI-powered assistant that lets you interact with your observability data through natural language. Think of it as your always-available, context-aware SRE sidekick.

What is a Conversational Co-Pilot?

A Conversational Co-Pilot is an embedded virtual assistant within the Perviewsis observability platform that enables users to:


  • Ask questions in natural language
  • Receive context-rich answers drawn from telemetry
  • View automatic visualizations, summaries, and correlations
  • Get actionable suggestions, including runbooks, tests, or automated remediations

Powered by large language models fine-tuned on telemetry patterns and your unique environment, Co-Pilots accelerate insights and eliminate manual toil.

What Makes It Intelligent?

Unlike basic search interfaces, Perviewsis Co-Pilots understand:

Intent

Know whether you’re asking about performance, availability, anomaly detection, or version changes.

Context

Consider what’s currently happening in the system (e.g., ongoing incidents, deployments).

Architecture Awareness

Use topology maps and service relationships to surface relevant data and dependencies.

Historical Trends

Identify deviations from baseline behavior across time, users, or environments.

Domain Relevance

Understand and differentiate between application issues, infrastructure bottlenecks, and ML model drift.

Conversational Queries for All Telemetry

Ask in plain English:

Get immediate answers powered by correlations across:

Auto-Generated Visual Insights

The Co-Pilot doesn’t just tell you—it shows you. It can:


  • Generate time-series charts, heatmaps, flame graphs, and service maps
  • Overlay multiple signals (e.g., deploy events + latency + SLO violations)
  • Drill down into specific time ranges, services, pods, or user flows
  • Summarize patterns with natural-language explanations

Suggested Actions & Next Steps

Beyond insight, Perviewsis Co-Pilots provide action-oriented intelligence:


  • Recommend service restarts, pod rescheduling, or rollbacks
  • Suggest specific test suites to rerun based on observed issues
  • Link to documentation or internal runbooks for known errors
  • Offer summaries for status updates (e.g., “Generate a status update for this incident”)

Deep Integration with Your Stack

Co-Pilots are built to connect across your infrastructure, apps, and models:

Layer

  • Metrics
  • Logs
  • Traces
  • CI/CD
  • Model Ops
  • Kubernetes
  • Notifications

Examples of Supported Tools

  • Prometheus, Datadog, OpenTelemetry, CloudWatch
  • FluentBit, Loki, Elastic, Splunk, Cloud Logging
  • Jaeger, Zipkin, OpenTelemetry, Honeycomb
  • GitHub Actions, Jenkins, ArgoCD, Spinnaker
  • MLflow, Vertex AI, SageMaker, Weights & Biases
  • K8s events, pods, clusters, nodes, CRDs
  • Slack, Microsoft Teams, PagerDuty, Webhooks

LLM-powered observability co-pilot architecture

When a user asks a question in natural language, the Co-Pilot service interprets it and orchestrates data retrieval. Structured telemetry (metrics/traces) may be fetched via direct queries, while unstructured knowledge (docs, past incidents) is pulled via a Vector Knowledge Base for semantic context. The LLM then synthesizes an answer, which is returned as a conversational reply with insights or recommended actions. This co-pilot leverages both the precise data from the telemetry data lake and the semantic understanding from vector-indexed knowledge to provide in-depth answers.

Example Use-Cases

Root cause analysis

“Why did CPU usage on service A increase?” – The co-pilot might find that a deployment occurred at that time and error logs spiked, suggesting a bad code push.

Ad-hoc reporting

“How many users signed up in the last 24 hours?” – If such business metrics are in the telemetry, the assistant can query and answer directly.

System suggestions

Some co-pilots even go beyond Q&A. For instance, New Relic’s Grok can suggest fixes or highlight anomalies proactively. A user might ask “Any anomalies today?” and the assistant could respond, “Yes, at 3:00 AM service B had an unusual memory leak (2x higher than baseline). This correlates with a deployment – consider rolling back.” The LLM cross-references anomaly detection outputs and known deployment events to generate this insight.

Role of RAG and Vector Indexing

The retrieval-augmented approach is crucial to keep the LLM grounded. Metrics and logs are constantly changing, so the latest data is retrieved at query time rather than relying on the LLM’s parametric memory. The vector index can store:

  • Documentation (e.g. runbooks, architecture diagrams) so the assistant
    can refer to system knowledge when answering “what does this
    service do?” or providing remediation steps.
  • Historical incident summaries, enabling the co-pilot to recall similar
    past incidents: “This outage resembles the incident on Jan 5th (ID
    12345), which was caused by a database failover.”
  • Recent logs or anomalies encoded as embeddings, so if a user asks
    about “errors around 3 PM”, the assistant can semantically grab the
    most relevant log lines instead of thousands of lines.

The prompt engineering ensures that the LLM’s output is formatted usefully.
For example, it might be told to include bullet points or specific data if available
(“If relevant logs are provided, include the log excerpt in the answer”). The
system could also define the style (concise vs. detailed) and caution the LLM
against guessing. By providing the factual telemetry context, the co-pilot
minimizes hallucinations and focuses on analysis of real data.

Feasibility

This isn’t science fiction – New Relic’s GenAI assistant (“Grok”) and others are pioneering this. New Relic’s assistant allows users to ask questions in plain language and returns analysis with anomaly insights and recommended fixes. Under the hood, as described above, it combines LLMs with their unified telemetry platform. Another example is an approach where the LLM translates natural language to a query and fetches data: network engineers have shown LLMs generating SQL/PROMQL from questions to query structured telemetry directly. In more advanced setups, a hybrid approach is used: the system might first use vector search to grab any textual context (like relevant log lines or config info) and then have the LLM formulate a precise query to the metrics DB. This ensures both unstructured and structured data
are leveraged optimally. In summary, conversational co-pilots democratize observability data. Engineers (and even non-engineers) can simply ask in natural language and get deep insights without manually digging through dashboards. The combination of an LLM with RAG on telemetry makes troubleshooting faster and accessible to a broader team, which can significantly reduce MTTR (Mean Time to Resolve) by cutting down the analysis time.

perviewsis Start Your Free Trial

Ready to Transform Your Observability?

Join leading engineering teams who’ve reduced MTTR by 75% and achieved 99.9% uptime with AI-powered observability.

No credit card required · 14-day trial · Full platform access